
Patrick Jones
Vice President, Strategic Alternatives
Contributing Editor
Background. There is an old proverb, a back handed insult really, something about living in interesting times. Perhaps you know the quote. Well, I think these are indeed interesting times for many reasons, primarily because we have been living and doing business in such a prolonged period of historically low interest rates. In my work with Chemark Consulting Group, I see a variety of companies and have the opportunity to work with clients of all sizes and at every position in the value chain – raw materials suppliers, formulators and end users. Sometimes strategic considerations necessitate acquisition or exit as CEOs structure corporate portfolios and SBU leaders seek to grow and optimize their businesses. From my vantage point as a specialized industry consultant working with a multitude of clients I see many trends, commonalities and differences between classes of buyers and sellers of business assets. The impact of cheap capital on valuations, the resulting buyer and seller behavior and ultimately the deal structures are among those things heavily influenced by the general interest rate environment.
In the past 2o years or so, as globalization and the explosion of growth in China has washed over the economic landscape, global wealth has become more concentrated as evidenced by the exploding number of billionaires in China and around the world. Forbes, the well-respected business magazine, publishes an annual listing of the world’s billionaires along with some basic statistics quantifying their estimated net worth, line of business, etc. In 2000, Forbes listed 470 billionaires with a total net worth of $898 billion. By 2016, a down year, the tally had grown to include 1810 people worth a total of $6.5 trillion, and 2015 totals were even greater when Forbes counted 1826 people worth over $7 trillion. And in May 2016, Bloomberg’s Margaret Collins and Devin Banerjee estimated that, “$4 trillion in family capital globally is up for grabs.” It has been estimated by others that perhaps half of this capital resides or is controlled by those who reside in the United States.
But chances are that if you are reading this column then, like me, you are not on the Forbes list of billionaires. So why should you care what happens with all that money? More on that in a bit…
Similarly, since the Great Recession, corporations have amassed unprecedented cash balances. According to a June 11, 2015 article published by Business Insider, at the end of 2014 US non-financial corporations had amassed a cash hoard of $1.82 trillion, up 5% from 2013 and growing, with the top 25 cash holders controlling 48%. Companies such as Google, Pfizer and General Motors reported cash balances in excess of $50 billion each at the end of 2014 with Apple and Microsoft maintaining cash in excess of $100 billion apiece. By January 2016, according to New York Times Magazine’s Adam Davidson, the US corporate cash total exceeded $1.9 trillion.
Initially, cash accumulation was seen as insurance against another global financial calamity, and it has evolved into dry powder presumably poised for investment in the next great thing that promises to transform our way of living and/or doing business. It is accumulating over time as a result of conservative financial management and elaborate tax-minimization strategies that have generated huge overseas cash balances that cannot be repatriated easily.
Meanwhile, economic waters have calmed considerably and the world’s major economies are no longer on the brink. Yet, while consistently positive, growth has been tepid and to many wage earners, the recovery just has not felt like a true recovery should feel. For this reason what happens to all that available private capital and public company cash should be of interest to the rest of us. Because, no matter how you slice it, these are staggering sums of money, and how, when and where the capital is deployed (or not) has a tremendous influence on our general economic well-being.
Private Equity. As I noted at the outset, the backdrop to the current environment (and perhaps a major contributing factor) is the prolonged period of near-zero interest rates in the world’s major economies. This low-yield investments universe has been particularly perplexing for the managers of the world’s elite fortunes where lifestyle support, preservation of generational wealth and tax minimization are dominant concerns. When interest rates on even long-term debt barely cover short-term inflation, where does one go to find an acceptable risk-weighted yield? The days of safely allocating a sizeable portion of the family nest egg to fixed income investments and enjoying attractive cash-on-cash returns have given way to an altered reality where asset allocations are necessarily more heavily weighted in higher risk asset classes, and alternative investment vehicles such as hedge funds and private equity limited partnerships become critical.
Private Equity (PE) is the largest so-called alternative investment asset class, and due to the industry’s impact on mergers and acquisitions activity, we will take a closer look at the fundamentals, dimensions and factors driving the growth and performance of the sector. In its 2016 report entitled “Private Equity Growth in Transition Evolve to Meet Tomorrow’s Challenges,” the Deloitte Center for Financial Services pegs global Private Equity assets, excluding venture capital, at $3.65 trillion with a 13.5% compound annual growth rate (CAGR) since year end 2005. Hedge funds, by comparison, comprise $2.8 trillion with a 7.5% CAGR over the same period. PE asset growth is expected to cool to 5% CAGR through 2020, enabling the industry to reach $4.66 trillion.
Deloitte defines the aggregate growth in PE Assets Under Management (AUM) noted above as the sum of growth in committed capital, often described as dry powder, plus the unrealized gains in the investment portfolios under management. To thrive and survive, a PE buyout firm must work constantly in two fundamental areas: attracting capital and deploying capital. How much money is flowing into PE and where does it originate? In 2015 Prequin Ltd., a specialist consulting firm that tracks and analyzes alternative asset classes, tallied $152 billion of PE buyout fund closings with the largest single fund, Blackstone Capital Partners VII, closing at $18 billion. Not surprisingly, 8 of the world’s top 10 PE firms are based in the US (2 in the UK), and typically over 80% of PE fund raising is done in the US or Europe.
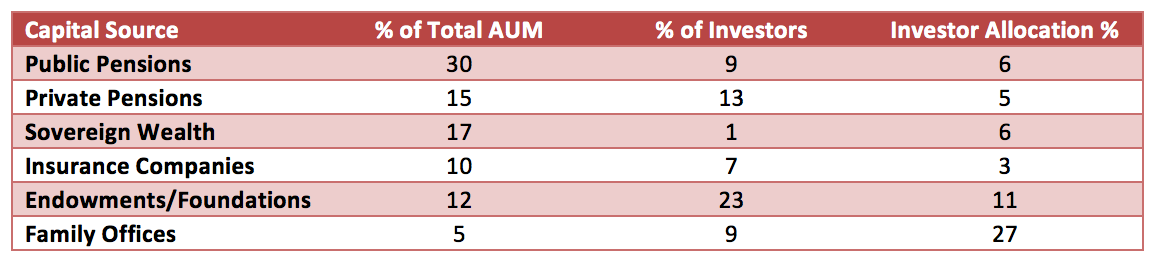
PE investors represent a broad spectrum. Again, taking data from Deloitte and Prequin, the top 7 investor groups allocating assets to PE funds are summarized in the table below.
Source: Deloitte
This data can be viewed a number of ways, but a couple of observations are particularly striking. First, pension funds and insurance companies provide 55% of the investment capital, yet their overall risk is minimal as they are allocating only 5% or so of their investable funds to PE. Second, although they comprise only 5% of AUM, family offices are heavily invested in PE with an asset allocation of 27%.
Additionally, investor allocations to PE appear to be increasing. Prequin data indicate that only 21% of institutional investors surveyed in the first half of 2016 had an asset allocation to PE below 5% as compared to 44% of respondents below a 5% allocation level 18 months prior (second half of 2014). Also, 56% of Family Offices surveyed in 2016 indicated “more appetite for private equity.” Taken in combination, one can sense the need for greater return on capital as even conservative investment professionals seek to increase their risk profiles.
Strategic Mega Deals. Increasingly, operational excellence on a global scale is a critical success factor in capital intensive industries such as chemicals. Producers need to be close to local markets, and operating leverage must be maximized to overcome high fixed costs associated with heavy capital investment. Consequently, with organic growth increasingly difficult to achieve, corporations flush with cash and access to cheap debt are predictably deploying their dry powder in pursuit of global consolidation, diversification and economies of scale in a wave of high profile, highly valued strategic mergers and acquisitions. We have every reason to expect this trend to continue if not accelerate as monetary policy shows signs of moving toward a more historical norm.
The table below highlights a few of the most highly publicized recent transactions in the chemicals and energy market space.
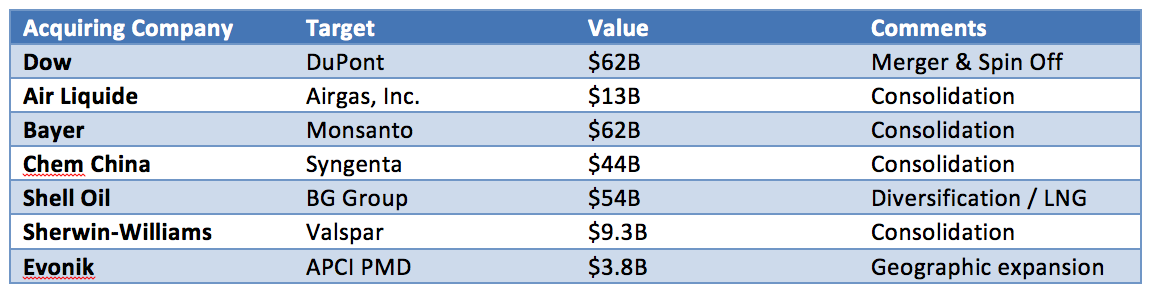
Source: Multiple
Family Offices. In addition to the growth in PE and the eye-watering scale of the strategic mega-deals that dominate the headlines, a less well publicized emerging trend that has captured my attention is the role of the Family Office as a direct investor in middle market companies. We are all familiar with terms like strategic buyer and hedge fund and private equity, but unless you closely follow the world of wealth management you may not be familiar with the lesser-known concept of the Family Office and the array of functions such an entity might perform.
Let’s start with a basic definition of the term Family Office. Investopedia describes the FO thusly:
“Family offices are private wealth management advisory firms that serve ultra-high net worth investors. Family offices are different from traditional wealth management shops in that they offer a total outsourced solution to managing the financial and investment side of a affluent individual or family. For example, many family offices offer budgeting, insurance, charitable giving, family-owned businesses, wealth transfer and tax services.”
Since many family fortunes are derived from successful privately held or family-owned businesses, it comes as no surprise that FO’s are among the top tier of investors in the PE space as highlighted in the discussion above. It stands to reason that there would be a natural affinity for investing in privately held companies if a family company was the source of initial wealth creation. But PE firms charge management fees, typically 2% of AUM, and routinely take 20% of the profits upon exit. This model works best when the PE is significantly larger than the FO as the investor can leverage the benefits of asset pooling, but what happens when the FO and the PE are of equal size or the FO is larger?
The short answer, according to Russ Alan Prince (Forbes, December 2014), is that more and more FO’s are electing to bypass the PE and invest directly. At a certain level the economics favor hiring dedicated professional staff and creating effectively specific, in-house buyout firms within the FO structure. Some are well known, names like Pritzker, Gates and Dell, with $billions of capital doing their own mega deals like Dell’s $67B acquisition of EMC. But in a January 2016 article published by Mergers & Acquisitions (www.themiddlemarket.com) Danielle Fugazy noted that most are focused on the middle market where good companies with differentiated market positions can be acquired and nurtured for the long term. She went on to write that, in 2014, 77% of respondents surveyed by McNally Capital indicated a preference for direct investing versus PE, up from 59% in 2010. The middle market appears to be a good fit as owners of middle market companies often respond favorably to the flexible deal terms, longer/indefinite hold periods and ready access to capital typically offered by the FO buyer.
Implications. Since this is Coatings World and we are all involved in the broader chemicals industry, I wanted to get an indication of the relative attractiveness of chemicals, and by extension, the paints and coatings value chain to potential FO investors. Data on just the coatings sector is not easy to find, but there are published statistics available summarizing the deal flow in the chemicals industry. The data in the table below was compiled by PWC and excerpted from its chemicals industry M&A summary for 2015.
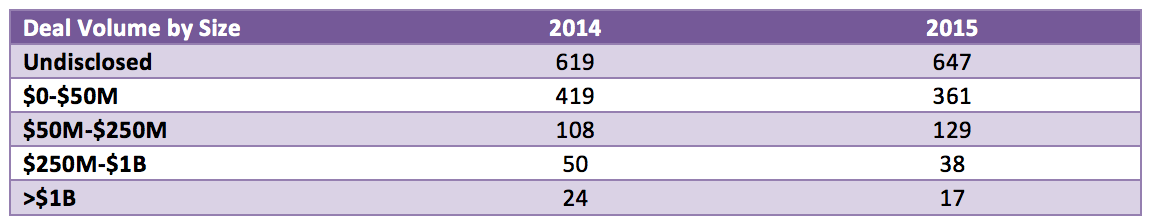
Source: PWC
Different sources define the term middle market differently, but for the purposes of this article I am thinking of deals valued at up to $250 million. Based on the PWC statistics, a typical year in the chemicals industry produces at least 150 announced deals valued between $50M and $250M. Add in the smaller deals valued below $50 million and, assuming that the majority of deals with an undisclosed value fall at or below our $250 million cut-off, the total amenable middle market for chemicals M&A could be as large as 1100 to 1200 deals per year.
In the next installment, I will take a look at how Strategic Buyers, PE’s and FO’s influence the world of mergers and acquisitions and examine some of the key issues and implications for hot-button topics such as valuation, deal structure and the potential convergence between these three classes of buyers as we consider the “new normal” going forward.